Debug Mode
Debug Mode
toggles debug-mode on/off affecting all patches/nodes in the current instance of vvvv.exe
SHIFT+CTRL+F9
toggles debug-mode on/off affecting only the currently selected patches/nodes
Need confirmation from devvvs for a few ones:
what is the meaning of the colors on the inlets?
green seems to an inlet that requests data. (see below)
red seems to be an in/outlet thats spreadcount changes (seems verified with many tests)
blue seems to be an in/outlet that gets calculated.
~~#cccccc:white~~ seems to be ???
A node with pins all gray has the "Autoevaluate" option turned off, and is "Inactive"
- Autoevaluate option turned off means that if there is no other node asking for it's own results, it won't evaluate.
- Autoevaluate option turned on means the node executes every frame.
The is two pin types for value in vvvv:
- Value In : We can request if the PinHaschanged, which will do a spread comparison with the last frame (slice per slice). So if your spread size is 50000 you do 50000 equal operations. This can be nice for some pins which always have a low spreadcount, and generate a large spread. When a "PinIsChanged event" is set to true, the inlet turns to green.
- Value Fast In: Doesn't look like for spread change, so only gets data. Useful if you want to process the data regardless.
in what units the values are expressed ?
Values are expressed in thousands of ticks.
A tick is the lowest unit of time on a processor, so it depends on processor architecture.
On probably most of pc modern processors, 1 tick = 1/10000 milliseconds.
Which means if your value is 130, your node takes 13ms to process.
(Note: to calculate that, created a plugin with a hi perf timer, and outputted the plugin processing time in an outlet, which seemed to verify this).
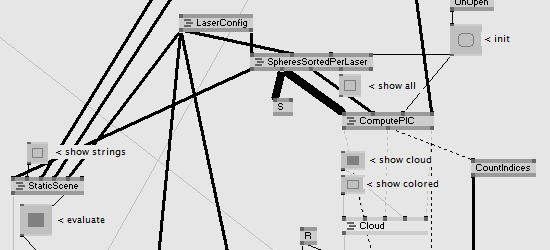
Debugging spreads
toggles spreadcounts debug-mode on/off affecting all patches/nodes in the current instance of vvvv.exe

A link can have any of 4 styles:
    dotted: when carrying ø
    normal: when carrying 1 slice
    thin: when carrying a slicecount less than half of the patchs maximum spreadcount
    thick: when carrying a slicecount greater then half of the patchs maximum spreadcount
    fat: when carrying the patchs maximum spreadcount
We hope this to be specifically usefull when teaching beginners about spreads or hunting for large spreads or ø.
anonymous user login
Shoutbox
~1yr ago
~1yr ago
~1yr ago
~1yr ago
~1yr ago
~1yr ago
~1yr ago
~1yr ago
~1yr ago
~1yr ago

