Tutorial SpreadsII
French | Russian | Japanese | Italian | Korean | Mandarin
The following tutorial assumes that you have already worked through tutorial IV: IOBoxes.
Recall
Now that we've learned how to deal with IOBoxes let's have another look at how nodes deal with spreads.
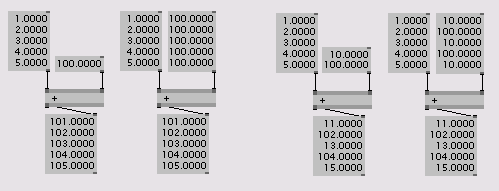
The two samples give you an idea what happens inside a node if it has to deal with spreads of different slicecount. Note that the first two and the last two graphs have the same result.
If that last paragraph confused you more than it helped you understand the subject. Well. Never mind. Often times simple things are hard to explain. If you've read this far you may have already understood the whole thing, even though you are not completely aware of it. Just quickly have a look at the next example.
Effortless handling of multiple Instances
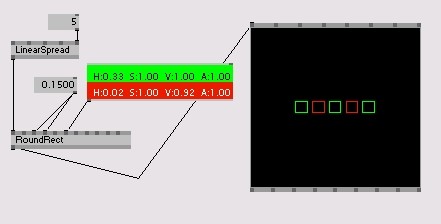
Suppose you have a RoundRect (GDI) linearly spreaded along its X coordinate and now you want every first rectangle be drawn green and every second drawn in red.
Now how would you go about having a grid of 5x5 rectangles? Your first thought may be to simply connect the LinearSpread (Spreads) to the RoundRect (GDI)s Y input. But see what happens:
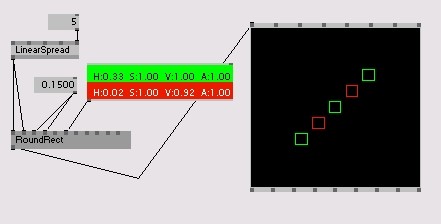
Still the RoundRect (GDI) only draws itself only 5 times because the maximum slicecount on its inputs is still 5. The first X coordinate is the same as the first Y coordinate, second X is same as second Y and so on resulting in an ascending order.
Thank vvvv there is a node, that comes in handy for the purpose of generating coordinates for a grid structure. Try the Cross (2D) node as shown in the screenshot below.
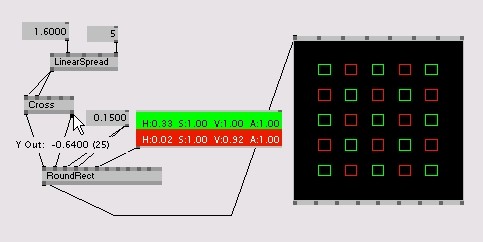
Cross (2D) outputs 25 slices for X and Y each which represent every possible combination of the input slices. Also note the distance between the rectangles can now be adjusted via the second input on the LinearSpread (Spreads).
Finally let's add some interaction again. Say we want to know the distance of each rectangle to the mouse cursor. Again there is a node for such tasks: Points2Vector (2D) gives you the distance between 2 points. Connect the node like shown below and guess what the 25 numbers in the bottom-right IOBox stand for.
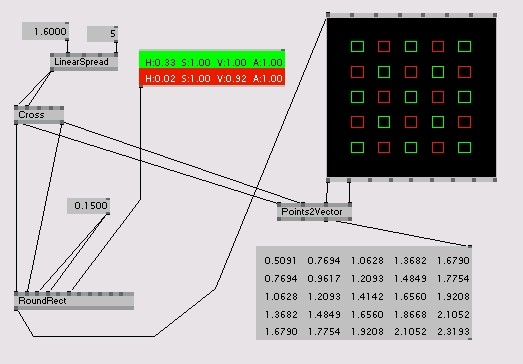
Right. Points2Vector (2D) is so neat and returns us the 25 distances of each of the grids points to the mouse coordinate.
Now map those distances to a reasonable length so that we can use it as a size for the RoundRect (GDI)s. Call it multimedia.
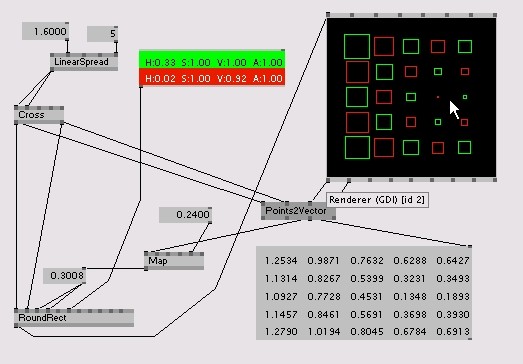
Now adjust the Spreadcount of the LinearSpread (Spreads) and you'll see: No matter how many rectangles you want to deal with, the patch stays as simple as on the first day.
There are still some more things to know about spreads but for now you are released. Whenever you have the feeling you are missing some information browse the manual section on Spreads for additional details.
anonymous user login
Shoutbox
~1yr ago
~1yr ago
~1yr ago
~1yr ago
~1yr ago
~1yr ago
~1yr ago
~1yr ago
~1yr ago
~1yr ago

